As COVID has changed client expectations around when, how, and where to meet with your organization, how are you adjusting your business to align with customer demand, stay ahead of the competition and still meet your business objectives around growth/revenue/profits? With Engageware’s Analytics for Appointment Scheduling, companies can understand the days and times that are most popular with their clients and adjust their employees’ schedules to best meet the customer demand. This can help in reducing times when no employees are available, as well as making sure the times that your employees have open for appointments aligns with when clients want to meet.
One of the key dashboards in Engageware Analytics is the Heat Map dashboard, which illustrates the most popular dates and times for appointments and walk-ins per day of the week and hour of the day. Heat Map dashboards provide a simple visual representation of high volume and low volume days and times to better understand member and customer traffic patterns.
Overall Trends
With the heatmap dashboard, it is easy to identify the busiest and quietest times of the week over a specific date range. By analyzing this data at a high level, it is clear in the below example that Saturdays, Friday evenings, and 4pm each day tend to be the times that clients are most looking to meet.
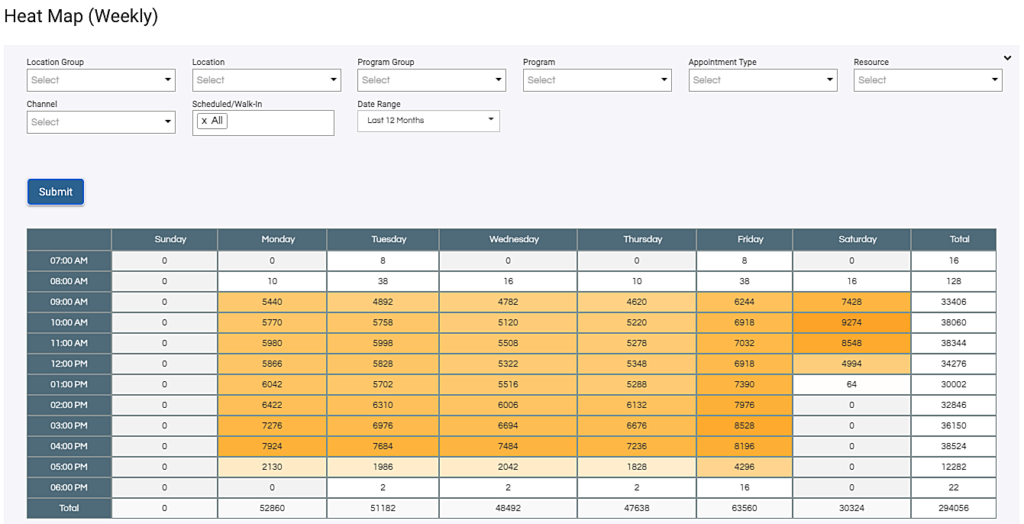
With this data, staff schedules can be optimized to either add more employees to Saturdays and Fridays, or make sure employees’ calendars are open during those times as customers are most likely to meet at that time of the week.
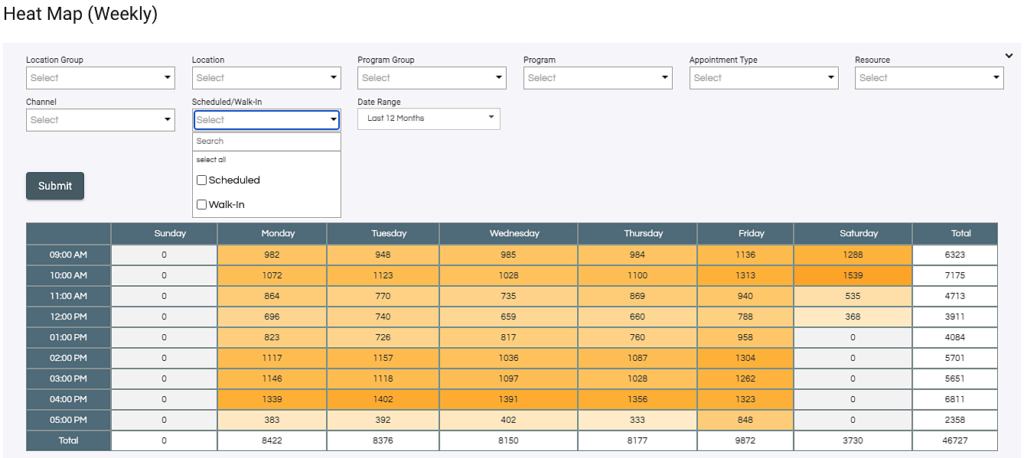
Scheduled vs Walk-Ins
The heat map dashboard can also be filtered to only show data for walk-ins or appointments, allowing optimizations to be made based solely on walk-in traffic or optimizing schedules for staff that service pre-scheduled appointments.
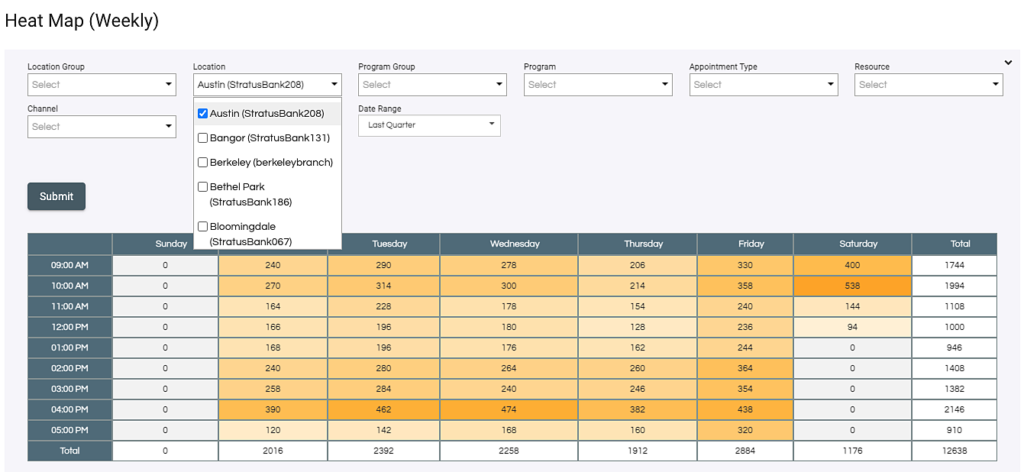
Location by Location
Analyzing the most popular days and times for appointments and walk-ins can also be drilled down per location. By utilizing the location filter, branch and store managers can identify ways they can improve their specific location’s schedules based off demand for appointments and walk-ins.
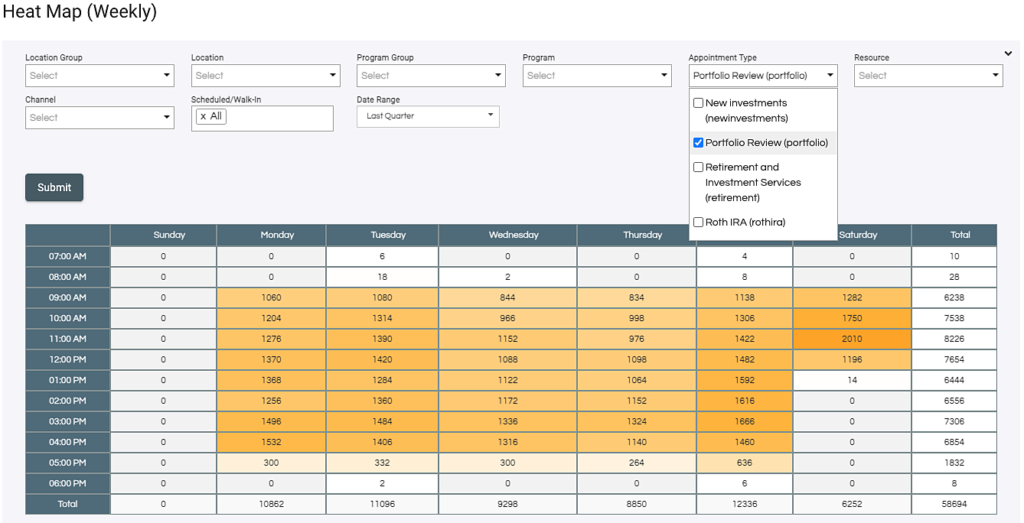
Topic by Topic
The heat map dashboard can also be broken down by different business departments or appointment topics to understand customer behavior by category and topic. The mortgage department can update their schedules to better align with the days and times that customers want to meet, and branches can better staff locations to make sure that employees that are able to handle notary services or special appointment types are scheduled based off when clients most often look to schedule those appointments.
Whether looking to understand customer demand for appointments vs walk-ins, per location, topic, or interaction type, Engageware Analytics provides the necessary data that your organization can use to better meet customer demand. Optimizing staff schedules can help in reducing wait times and increasing customer satisfaction. For more information, checkout the Reporting and Analytics page or Schedule Time to talk with one of our scheduling experts today.